Introduction
This past weekend I got the chance to go to the Tampa Bay Rays vs Cleveland Indians game. This game was a ton of fun, made even more exciting for me - and by the end of the game, the people in my section - because my brother-in-law’s brother (does that make him my brother-in-law too? No one ever knows for sure…), Joey Wendle, plays for the Rays! In case you haven’t been paying attention, Joey has been having a MASSIVE rookie season. Just take a look at some of the tweets from the Ray’s organization in the last few days.
The AL's top-hitting rookie is on a record pace.#RaysUp pic.twitter.com/2oo88IXS2f
— Tampa Bay Rays (@RaysBaseball) September 4, 2018
How many ways can one man impact a game?#RaysUp pic.twitter.com/iE3izrtc70
— Tampa Bay Rays (@RaysBaseball) September 2, 2018
As you can see, the man has been getting it done at the plate and in the field. This has led some to call for his inclusion in the AL Rookie of the Year conversation.
#Rays Joey Wendle put on a show on Sunday and it’s time to start talking about him as a legit AL Rookie of the Year contender: https://t.co/G9sFvLLeLq
— Juan Toribio (@juanctoribio) September 3, 2018
I have been looking for a good excuse to play around with Thomas Pedersen’s gganimate package, and what better way then by taking a look at Joey’s rookie season.
Before we start, let’s load the R packages that we will use.
library(tidyverse)
# devtools::install_github("BillPetti/baseballr")
library(baseballr)
# devtools::install_github("thomasp85/gganimate")
library(gganimate)
library(lubridate)
library(fuzzyjoin) # for position graph
Getting the data
There are several sources of MLB data available on the internet, and the baseballr package by Bill Petti makes getting this data super easy. The sources of data that I will use in this post are from the Baseball Savant website for batting data and Fan Graphs for fielding position. These sites both provide game by game data for any player in the league for any season. The Baseball Savant site provides pitch by pitch data about each of Joey’s at-bats and the Fan Graphs site provides game by game stats.
baseballr provides different functions for the different data sources, but first we will have to get Joey’s player id from these sites. We can use the playerid_lookup function to find it.
playerid_lookup("Wendle", "Joey") %>% glimpse()## Observations: 1
## Variables: 11
## $ first_name <chr> "Joey"
## $ last_name <chr> "Wendle"
## $ given_name <chr> "Joseph Patrick"
## $ name_suffix <chr> NA
## $ nick_name <chr> NA
## $ birth_year <int> 1990
## $ mlb_played_first <int> 2016
## $ mlbam_id <int> 621563
## $ retrosheet_id <chr> "wendj002"
## $ bbref_id <chr> "wendljo01"
## $ fangraphs_id <int> 13853Now we can look up both the Fan Graphs and Baseball Savant data. From the above we can see that his Fan Graphs id is “13853”.
joey_fg <- baseballr::batter_game_logs_fg("13853", year = 2018)joey_fg %>% as_tibble()## # A tibble: 119 x 23
## Date Team Opp BO Pos PA H X2B X3B HR R RBI
## <chr> <chr> <chr> <chr> <chr> <chr> <chr> <chr> <chr> <chr> <chr> <chr>
## 1 2018~ TBR @TOR 4 2B 4 0 0 0 0 0 0
## 2 2018~ TBR @TOR 5 2B 4 0 0 0 0 0 0
## 3 2018~ TBR @TOR 5 SS-3B 4 3 1 0 0 1 0
## 4 2018~ TBR @CLE 1 3B 5 2 1 0 0 1 1
## 5 2018~ TBR @CLE 1 2B 5 2 1 0 0 1 0
## 6 2018~ TBR @CLE 1 2B 4 1 0 0 0 0 0
## 7 2018~ TBR @ATL 5 2B 5 2 0 0 0 2 2
## 8 2018~ TBR @ATL 1 2B 5 2 0 0 0 1 0
## 9 2018~ TBR BOS 1 2B 5 2 1 0 0 1 0
## 10 2018~ TBR BOS 1 2B 5 2 0 0 0 0 1
## # ... with 109 more rows, and 11 more variables: SB <chr>, CS <chr>,
## # BB_perc <dbl>, K_perc <dbl>, ISO <chr>, BABIP <chr>, AVG <chr>,
## # OBP <chr>, SLG <chr>, wOBA <chr>, wRC_plus <chr>We can do the same with the Baseball Savant data using the corresponding player id - “621563”
joey_bsvnt <- scrape_statcast_savant_batter(start_date = "2018-03-29", end_date = Sys.Date(), batterid = "621563")joey_bsvnt %>% as_tibble()## # A tibble: 1,687 x 90
## pitch_type game_date release_speed release_pos_x release_pos_z
## <chr> <date> <dbl> <dbl> <dbl>
## 1 SI 2018-09-05 92.5 -2.44 5.48
## 2 SI 2018-09-05 93.2 -2.39 5.70
## 3 CH 2018-09-05 88.4 -2.03 5.53
## 4 CU 2018-09-05 78.5 -1.87 5.67
## 5 CU 2018-09-05 80.6 -1.98 5.63
## 6 CU 2018-09-05 79.3 -1.92 5.65
## 7 CU 2018-09-05 78.1 -2.02 5.69
## 8 FT 2018-09-05 92.3 -1.90 5.69
## 9 CH 2018-09-05 89.3 -1.92 5.57
## 10 FT 2018-09-05 93.9 -1.88 5.60
## # ... with 1,677 more rows, and 85 more variables: player_name <chr>,
## # batter <int>, pitcher <int>, events <chr>, description <chr>,
## # spin_dir <chr>, spin_rate_deprecated <chr>,
## # break_angle_deprecated <chr>, break_length_deprecated <chr>,
## # zone <int>, des <chr>, game_type <chr>, stand <chr>, p_throws <chr>,
## # home_team <chr>, away_team <chr>, type <chr>, hit_location <int>,
## # bb_type <chr>, balls <int>, strikes <int>, game_year <int>,
## # pfx_x <dbl>, pfx_z <dbl>, plate_x <dbl>, plate_z <dbl>, on_3b <dbl>,
## # on_2b <dbl>, on_1b <dbl>, outs_when_up <int>, inning <int>,
## # inning_topbot <chr>, hc_x <dbl>, hc_y <dbl>, tfs_deprecated <chr>,
## # tfs_zulu_deprecated <chr>, pos2_person_id <int>, umpire <chr>,
## # sv_id <chr>, vx0 <dbl>, vy0 <dbl>, vz0 <dbl>, ax <dbl>, ay <dbl>,
## # az <dbl>, sz_top <dbl>, sz_bot <dbl>, hit_distance_sc <int>,
## # launch_speed <dbl>, launch_angle <dbl>, effective_speed <dbl>,
## # release_spin_rate <int>, release_extension <dbl>, game_pk <int>,
## # pos1_person_id <int>, pos2_person_id_1 <int>, pos3_person_id <int>,
## # pos4_person_id <int>, pos5_person_id <int>, pos6_person_id <int>,
## # pos7_person_id <int>, pos8_person_id <int>, pos9_person_id <int>,
## # release_pos_y <dbl>, estimated_ba_using_speedangle <dbl>,
## # estimated_woba_using_speedangle <dbl>, woba_value <dbl>,
## # woba_denom <int>, babip_value <int>, iso_value <int>,
## # launch_speed_angle <int>, at_bat_number <int>, pitch_number <int>,
## # pitch_name <chr>, home_score <int>, away_score <int>, bat_score <int>,
## # fld_score <int>, post_away_score <int>, post_home_score <int>,
## # post_bat_score <int>, post_fld_score <int>,
## # if_fielding_alignment <chr>, of_fielding_alignment <chr>, barrel <dbl>While the baseball savant data has a ton of information, it does not have stats per game or cumulative stats for the season. However, using the data that we have, these things can be calculated easily! To do this, we will define a custom function to calculate a few standard sabermetrics (i.e. batting average, slugging, on base percentage, etc.).
savant_daily <- function(data){
  output <- data %>%
    filter(!is.na(events), events != "caught_stealing_2b") %>%
    mutate(
      is_ab = if_else(
        events %in% c("strikeout", "field_out", "single", "double", "force_out",
                      "triple", "home_run", "double_play", "field_error", "grounded_into_double_play",
                      "strikeout_double_play", "fielders_choice_out"),
        TRUE,
        FALSE
      ),
      is_hit = if_else(
        events %in% c("single", "double", "triple", "home_run"), TRUE, FALSE
      ),
      bases = case_when(
        events == "single" ~ 1,
        events == "double" ~ 2,
        events == "triple" ~ 3,
        events == "home_run" ~ 4,
        TRUE ~ 0
      ),
      event_custom = case_when(
        events %in% c("single", "double", "triple", "home_run") ~ events,
        str_detect(events, "sac") ~ "sacrifice",
        events %in% c("walk", "hit_by_pitch") ~ NA_character_,
        events == "field_error" ~ "error",
        TRUE ~ "out"
      )
    ) %>%
    group_by(game_date) %>%
    summarize(
      pa = length(unique(at_bat_number)),
      ab = sum(is_ab),
      hits = sum(is_hit),
      doubles = sum(events == "double"),
      triples = sum(events == "triples"),
      home_runs = sum(events == "home_run"),
      bb = sum(events == "walk"),
      hbp = sum(events == "hit_by_pitch"),
      so = sum(events %in% c("strikeout", "strikeout_double_play")),
      bases = sum(bases)
    ) %>%
    arrange(game_date) %>%
    mutate(
      ba = round(hits/ab, 3),
      obp = round((hits + bb + hbp)/(ab + bb + hbp), 3),
      slg = round(bases/ab, 3),
      ops = obp + slg,
      hits_to_date = cumsum(hits),
      bb_to_date = cumsum(bb),
      hbp_to_date = cumsum(hbp),
      ab_to_date = cumsum(ab),
      bases_to_date = cumsum(bases),
      ba_to_date = round(hits_to_date/ab_to_date, 3),
      obp_to_date = round(
        (hits_to_date + bb_to_date + hbp_to_date)/(ab_to_date + bb_to_date + hbp_to_date), 3
      ),
      slg_to_date = round(bases_to_date/ab_to_date, 3),
      ops_to_date = obp_to_date + slg_to_date
    )

  return(output)
}
joey_bsvnt_daily <- savant_daily(joey_bsvnt)
joey_bsvnt_daily %>% glimpse()## Observations: 117
## Variables: 24
## $ game_date <date> 2018-03-29, 2018-03-30, 2018-03-31, 2018-04-01,...
## $ pa <int> 1, 1, 4, 4, 3, 1, 3, 2, 5, 6, 4, 4, 4, 4, 4, 2, ...
## $ ab <int> 1, 1, 3, 4, 3, 1, 3, 2, 5, 3, 3, 4, 3, 2, 3, 2, ...
## $ hits <int> 0, 0, 0, 2, 0, 1, 2, 1, 2, 1, 0, 0, 1, 0, 0, 1, ...
## $ doubles <int> 0, 0, 0, 1, 0, 0, 1, 0, 0, 0, 0, 0, 1, 0, 0, 0, ...
## $ triples <int> 0, 0, 0, 0, 0, 0, 0, 0, 0, 0, 0, 0, 0, 0, 0, 0, ...
## $ home_runs <int> 0, 0, 0, 0, 0, 0, 0, 0, 1, 0, 0, 0, 0, 0, 0, 0, ...
## $ bb <int> 0, 0, 0, 0, 0, 0, 0, 0, 0, 3, 1, 0, 1, 1, 1, 0, ...
## $ hbp <int> 0, 0, 0, 0, 0, 0, 0, 0, 0, 0, 0, 0, 0, 1, 0, 0, ...
## $ so <int> 0, 0, 2, 0, 0, 0, 1, 0, 1, 2, 1, 2, 0, 1, 0, 1, ...
## $ bases <dbl> 0, 0, 0, 3, 0, 1, 3, 3, 5, 1, 0, 0, 2, 0, 0, 1, ...
## $ ba <dbl> 0.000, 0.000, 0.000, 0.500, 0.000, 1.000, 0.667,...
## $ obp <dbl> 0.000, 0.000, 0.000, 0.500, 0.000, 1.000, 0.667,...
## $ slg <dbl> 0.000, 0.000, 0.000, 0.750, 0.000, 1.000, 1.000,...
## $ ops <dbl> 0.000, 0.000, 0.000, 1.250, 0.000, 2.000, 1.667,...
## $ hits_to_date <int> 0, 0, 0, 2, 2, 3, 5, 6, 8, 9, 9, 9, 10, 10, 10, ...
## $ bb_to_date <int> 0, 0, 0, 0, 0, 0, 0, 0, 0, 3, 4, 4, 5, 6, 7, 7, ...
## $ hbp_to_date <int> 0, 0, 0, 0, 0, 0, 0, 0, 0, 0, 0, 0, 0, 1, 1, 1, ...
## $ ab_to_date <int> 1, 2, 5, 9, 12, 13, 16, 18, 23, 26, 29, 33, 36, ...
## $ bases_to_date <dbl> 0, 0, 0, 3, 3, 4, 7, 10, 15, 16, 16, 16, 18, 18,...
## $ ba_to_date <dbl> 0.000, 0.000, 0.000, 0.222, 0.167, 0.231, 0.312,...
## $ obp_to_date <dbl> 0.000, 0.000, 0.000, 0.222, 0.167, 0.231, 0.312,...
## $ slg_to_date <dbl> 0.000, 0.000, 0.000, 0.333, 0.250, 0.308, 0.438,...
## $ ops_to_date <dbl> 0.000, 0.000, 0.000, 0.555, 0.417, 0.539, 0.750,...Fielding Positions
Joey started the season sharing second base duties and was not used in many other positions. However, as the season has progressed, the Rays have given him opportunities at several other positions and Joey has stepped up every time. I mean, just look at those web gems in the tweet at the beginning of this post! Seriously, go watch them again, I will wait…
As a first stab at gganimate, let’s take a look at where Joey has played each game with the help of baseballr’s ggspraychart function. First, we can define coordinates (relative to ggspraycharts field definition) for each of the positions that he has played.
position_loc <- tribble(
  ~position, ~x, ~y,
  "2B", 145, -145,
  "3B", 100, -160,
  "SS", 111, -144,
  "LF", 80, -100,
  "RF", 176, -100
)
Since Joey has played multiple positions in single games, a simple left join is not entirely appropriate. Using the fuzzyjoin package, we can match the position coordinates with the positions that are defined in the joey_fg data set by regex.
joey_position <- joey_fg %>%
  fuzzyjoin::regex_left_join(position_loc, by = c("Pos" = "position")) %>%
  mutate(Date = lubridate::ymd(Date))
Now, using the ggspraychart and the transition_time function, we can see how his position has changed with each day.
position_chart <- joey_position %>%
  filter(!is.na(position)) %>%
  ggspraychart(x_value = "x", y_value = "y", fill_value = "position") +
  scale_fill_manual(values = c("2B" = "red", "3B" = "blue",
                               "SS" = "green", "LF" = "yellow",
                               "RF" = "black"), na.translate = FALSE) +
  labs(title = "Joey Wendle 2018 position by game:{frame_time}",
       caption = "Data source: fangraphs.com\nBuilt with the baseballr package\n") +
  transition_time(Date) +
  theme(
    legend.title = element_blank(),
    plot.title = element_text(size = 14),
    plot.caption = element_text(size = 10, face = "bold"),
    legend.text = element_text(size = 12, face = "bold")
  )

animate(position_chart, width = 800, height = 800)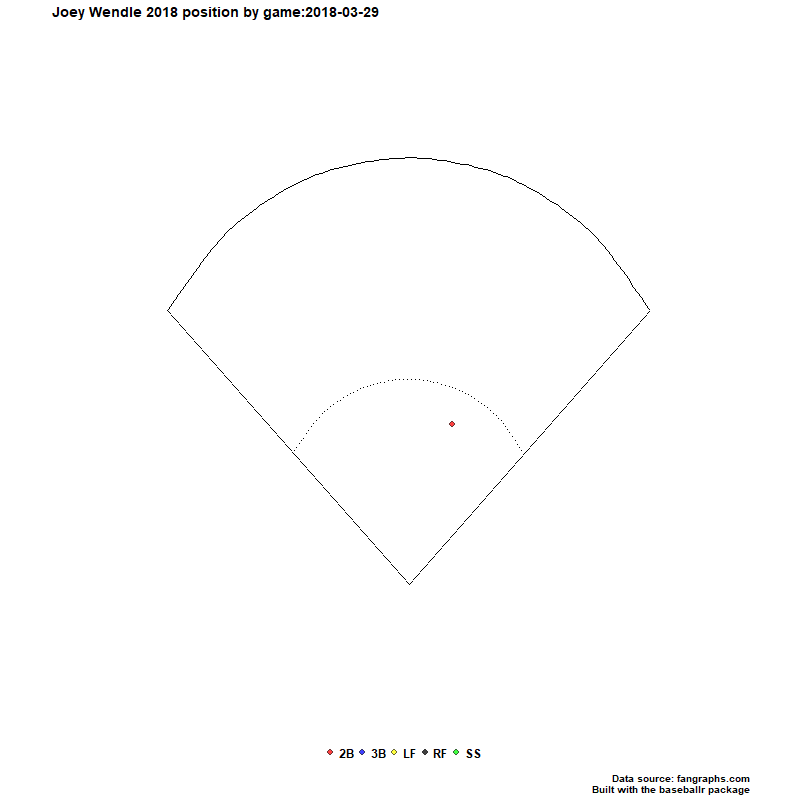
As this animation shows, he has been moved around the field much more towards the end of the year!
Batting
Now let’s use the ggspraychart to see how Joey’s hits have accumulated over the course of the season and where he tends to hit the ball. For this, we will use the raw baseball savant data set joey_bsvnt and use the function transition_reveal. This function allows for data to be added over a range rather than only showing the data for a specific date.
joey_spray <- joey_bsvnt %>%
  filter(events %in% c("single", "double", "triple", "home_run")) %>%
  mutate(events = factor(events, levels = c("single", "double", "triple", "home_run"),
                         labels = c("Single", "Double", "Triple", "Home Run"))) %>%
  ggspraychart(fill_value = "events",
               fill_palette = c("Single"="#A2C8EC", "Double"="#006BA4",
                                "Triple"="#FF940E", "Home Run"="#C85200")) +
  labs(title = "Joey Wendle 2018 hits to date: {frame_time}",
       caption = "Data source: baseballsavant.com\nBuilt with the baseballr package\n") +
  transition_reveal(game_date, game_date) +
  theme(
    legend.title = element_blank(),
    plot.title = element_text(size = 14),
    plot.caption = element_text(size = 10, face = "bold"),
    legend.text = element_text(size = 12, face = "bold")
  )


animate(joey_spray, width = 800, height = 800)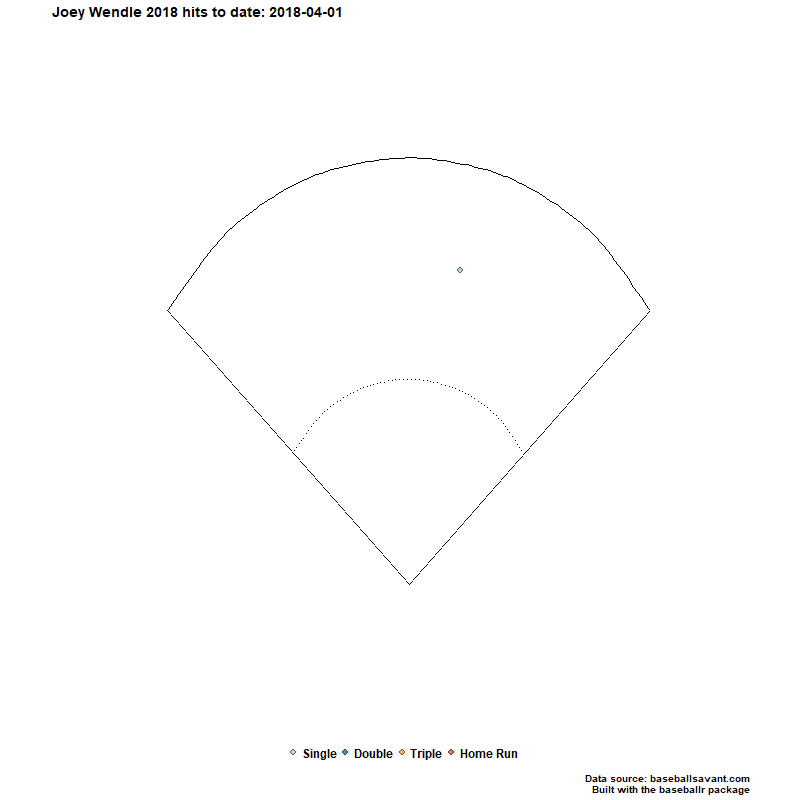
From this animation, Joey seems to hit most of his home runs to right field, but other than that he seems to spread his hits all around the field.
Let’s take a look at how Joey’s batting average has changed over time. We can use the daily statistics we calculated earlier to see how it changes over time using the transition_reveal function.
joey_rbi <- joey_bsvnt_daily %>%
  ggplot(aes(game_date, ba_to_date)) +
  geom_step(size = 1.5) +
  theme_bw() +
  labs(
    y = "Batting Average",
    title = "Joey Wendle's batting average during the 2018 season",
    caption = "Data source: baseballsavant.com\n"
  ) +
  scale_x_date(date_breaks = "2 weeks", date_labels = "%B %d, %Y") +
  scale_y_continuous(breaks = seq(0, 0.35, 0.05)) +
  theme(
    plot.title = element_text(size = 14, face = "bold"),
    plot.caption = element_text(size = 10, face = "bold"),
    axis.title.x = element_blank(),
    axis.text.x = element_text(angle = 45, hjust = 1, vjust = 1, face = "bold"),
    axis.text.y = element_text(face = "bold")
  ) +
  transition_reveal(id = game_date, along = game_date)


animate(joey_rbi, width = 800, height = 600)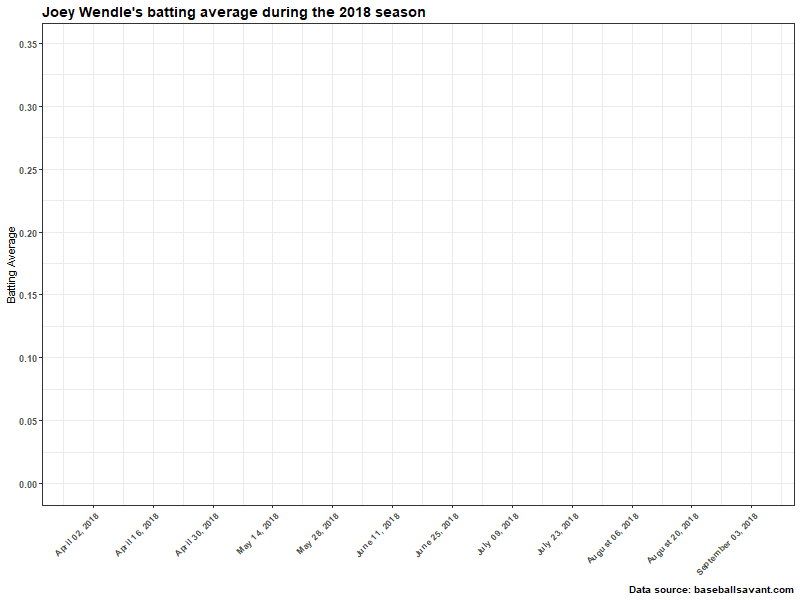
As we can see, Joey has stayed fairly consistent between 0.275 and 0.300 and has only been improving since the all-star break. Using the same functionality, we can look at multiple stats all at once by simply faceting the graphs. Here we can see how his batting average, slugging percentage and on-base percentage have changed over the course of the season.
multi_stats <- joey_bsvnt_daily %>%
  select(game_date, ba_to_date, slg_to_date, obp_to_date) %>%
  gather(key = "metric", value = "value", -game_date) %>%
  mutate(metric = case_when(
    metric == "ba_to_date" ~ "Batting Average",
    metric == "slg_to_date" ~ "Slugging",
    metric == "obp_to_date" ~ "On-base Percentage"
  )) %>%
  ggplot(aes(game_date, value)) +
  geom_step(size = 1.5) +
  facet_wrap(vars(metric), scales = "free_y", ncol = 1) +
  theme_bw() +
  scale_x_date(date_breaks = "2 week", date_labels = "%B %d, %Y") +
  theme(
    plot.title = element_text(size = 14, face = "bold"),
    plot.caption = element_text(size = 10, face = "bold"),
    axis.title = element_blank(),
    axis.text.x = element_text(angle = 45, hjust = 1, vjust = 1, face = "bold"),
    axis.text.y = element_text(face = "bold")
  ) +
  labs(
   title = "Joey Wendle's batting average, slugging, and on-base percentage, respectively",
   caption = "Data source: baseballsavant.com\n"
  ) +
  transition_reveal(game_date, game_date)

animate(multi_stats, width = 800, height = 1000)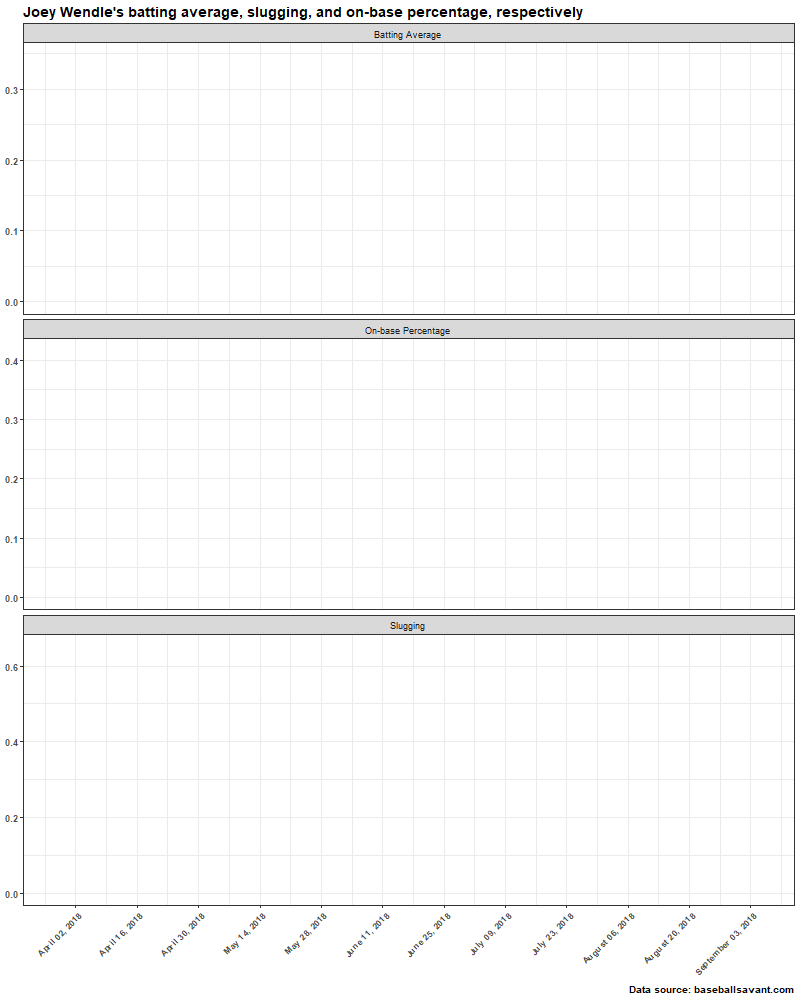
Conclusion
Joey is having a breakout year and the gganimate package gives us a cool way of viewing his progress over the course of the season. I hope you enjoyed the examples and I hope you root for Joey to finish off the year strong!
Please let me know what you think!